
Churn Rate: How to Calculate Customer Churn Rate, Examples and Its Importance
Quick Answer
Learn how to calculate, track, and reduce churn rate to drive growth. Actionable strategies to improve retention and boost customer satisfaction.
As your company enters the growth stage, the stakes become higher. Growth brings exciting opportunities, but it also introduces new challenges. Scaling operations, improving customer retention, and ensuring sustainable profitability require leaders to rely on Key Performance Indicators (KPIs) to make informed decisions.
One critical KPI to monitor during this stage is Churn Rate, as it directly reflects customer satisfaction and loyalty. In this blog, we’ll explore the importance of churn rate, how to calculate it, and actionable strategies to reduce it.
What is Churn Rate?
Churn rate is the percentage of customers who stop doing business with your company over a specific period. It’s a vital indicator of customer retention and satisfaction.
Why Churn Rate Matters:
- Customer Retention Drives Revenue:
Acquiring new customers is significantly more expensive than retaining existing ones. A high churn rate can erode profits and stunt growth. - Predicts Business Stability:
A low churn rate signals strong customer loyalty and satisfaction, ensuring a stable revenue stream. - Highlights Areas for Improvement:
Tracking churn provides insight into why customers are leaving, helping you identify and address pain points in your product or service.
How to Calculate Churn Rate
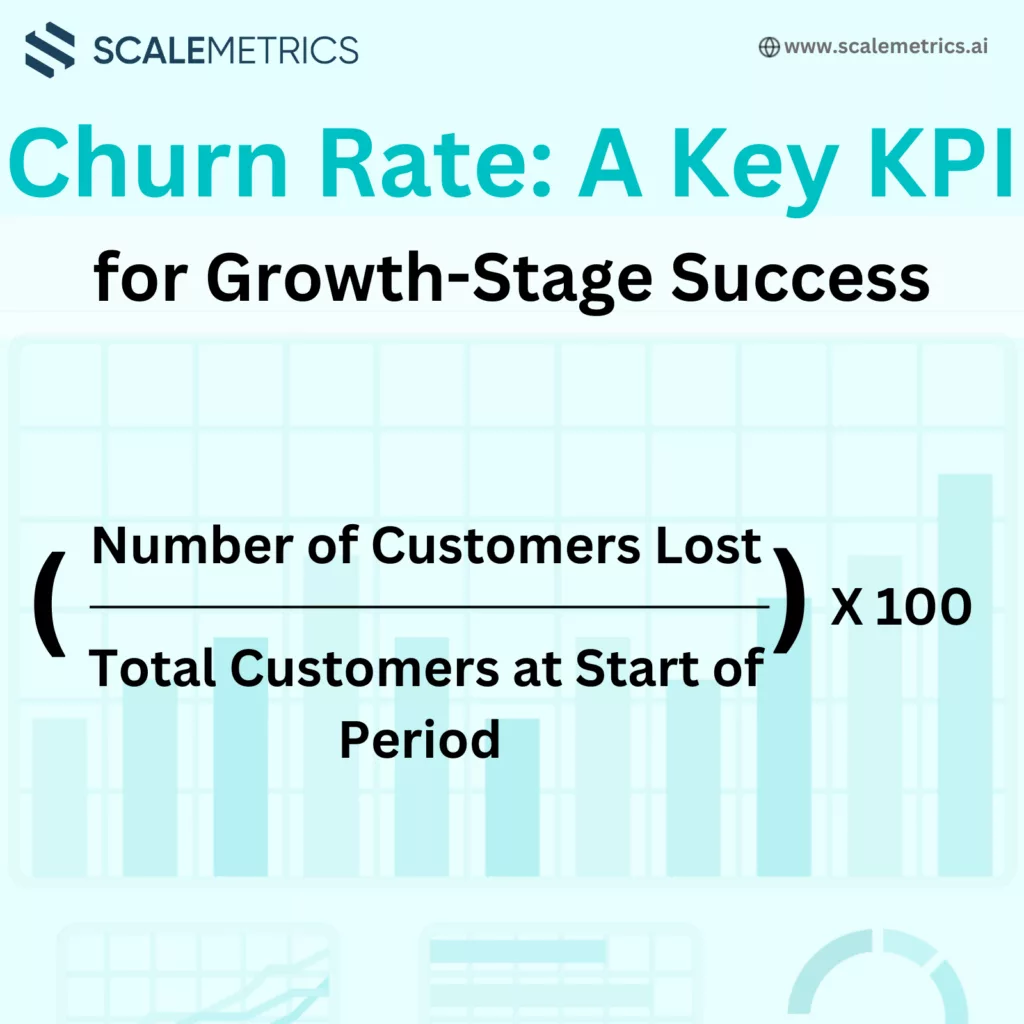
The formula for churn rate is straightforward:
Churn Rate = (Number of Customers Lost / Total Customers at Start of Period) × 100
Example Calculation:
Let’s say your business started the month with 1,000 customers and lost 50 by the end of the month.
Churn Rate = (50 / 1,000) × 100 = 5%
This means 5% of your customers left during the period, which could indicate issues requiring attention.
What Does Your Churn Rate Tell You?
A high churn rate can signal various underlying problems, including:
- Poor customer experience or support.
- Lack of product-market fit.
- Ineffective onboarding for new customers.
- Pricing issues or lack of perceived value.
Conversely, a low churn rate is a sign that customers are satisfied, engaged, and likely to remain loyal.
How to Reduce Churn Rate: Actionable Strategies
Reducing churn requires a combination of proactive retention strategies and a deep understanding of your customers’ needs. Here are five practical steps to lower churn:
1. Improve Customer Onboarding
The first 90 days are critical in retaining new customers. A confusing or incomplete onboarding process can lead to early churn.
Best Practices:
- Create clear, step-by-step guides or tutorials.
- Assign onboarding specialists for new clients.
- Use automated tools to ensure seamless onboarding experiences.
2. Prioritize Exceptional Customer Support
Customers are more likely to stay loyal if their issues are resolved quickly and efficiently.
Best Practices:
- Offer 24/7 customer support through multiple channels (email, chat, phone).
- Use AI tools to respond faster to common queries.
- Actively collect feedback and implement improvements based on it.
3. Offer Incentives for Loyalty
Reward programs or special discounts can encourage customers to stay longer and engage more frequently.
Ideas:
- Provide discounts for long-term subscriptions.
- Implement a tiered loyalty program with increasing benefits.
- Surprise customers with personalized offers based on their preferences.
4. Monitor and Act on Customer Feedback
Regularly analyze why customers churn to address root causes. Feedback from churned customers is particularly valuable.
How to Collect Feedback:
- Use exit surveys or automated feedback forms.
- Analyze patterns in support tickets or complaints.
- Conduct follow-up interviews with churned customers.
5. Continuously Improve Your Product or Service
Ensure your offerings evolve to meet customer expectations. A stagnant product can lead to churn as customers seek alternatives.
Tactics:
- Regularly release new features or updates.
- Invest in user experience (UX) improvements.
- Stay ahead of competitors by addressing emerging trends and technologies.
Benchmarking Churn Rate by Industry
Understanding industry-specific churn rates is crucial for benchmarking your company’s performance. Here are average churn rates across various industries:
| Industry | Average Churn Rate |
| Energy/Utilities | 11% |
| IT Services | 12% |
| Computer Software | 14% |
| Telecommunications | 31% |
| Consumer Goods/Retail | 5.5% |
| Manufacturing | 35% |
| Professional Services | 27% |
Note: These figures represent average churn rates and can vary based on specific market conditions and business models.
Sources:
- CustomerGauge: Average Churn Rate by Industry
- Stripe: What is an average churn rate? Here’s how to figure it out
Regularly comparing your company’s churn rate to these industry benchmarks can help identify areas for improvement and inform strategies to enhance customer retention.
Churn Rate and Other Key KPIs
While churn rate is a critical metric, pairing it with other KPIs provides a more comprehensive view of your company’s health. Consider tracking:
- Customer Lifetime Value (CLTV): Measures the total revenue generated by a customer during their relationship with your company.
- Net Promoter Score (NPS): Gauges customer satisfaction and likelihood to recommend your brand.
- Customer Acquisition Cost (CAC): Tracks the cost of acquiring new customers, helping you balance retention with acquisition efforts.
- Monthly Recurring Revenue (MRR): Indicates consistent income from subscription-based customers.
Conclusion: Churn Rate as a Growth Metric
Churn rate isn’t just a number-it’s a window into your customers’ satisfaction and your company’s ability to retain them. For growth-stage companies, reducing churn is one of the most impactful ways to secure long-term success.
By focusing on improving onboarding, delivering exceptional support, and continuously evolving your offerings, you can keep customers engaged and build a loyal base that drives sustainable growth.
Are you tracking your churn rate effectively? Start now to uncover new opportunities for improvement and growth.
Scalemetrics helps Swiss SMEs act on decisions like this before market conditions shift. Our business monitoring services and outsourced CFO team give finance directors the senior expertise to move first.
Sources & References
How to Calculate and Interpret Churn Rate for Swiss SMEs
Churn rate — the percentage of clients or subscribers who stop doing business with you over a defined period — is one of the most important metrics for any Swiss SME with a recurring revenue model. Whether you provide software subscriptions, ongoing consulting retainers, facilities management contracts, or regular product deliveries, understanding your churn rate is inseparable from understanding your revenue sustainability. A business with strong new client acquisition but high churn is running on a leaking bucket: it is working harder to fill the bucket than it would cost to plug the holes.
The basic churn rate calculation is: (customers lost in period / customers at start of period) × 100. If you began January with 80 clients and ended it with 74 active clients (having lost 6 and not counting any new clients acquired during January), your monthly churn rate is 7.5%. Annualised, this implies that approximately 90% of your client base turns over each year — a profoundly unsustainable position for most Swiss SMEs that rely on relationship continuity and high customer acquisition costs.
Revenue churn — the percentage of recurring revenue lost — is often more useful than customer churn for Swiss B2B businesses where clients vary significantly in size. A Swiss SME with CHF 500,000 in monthly recurring revenue that loses one client worth CHF 50,000 per month has a revenue churn rate of 10%, even if that client represented only 1 of 50 total customers. Revenue churn focuses management attention on the economically material relationships, which is where intervention effort should be concentrated.
Churn Benchmarks and the Swiss B2B Context
Swiss B2B churn benchmarks vary by sector, but professional services and consulting businesses should target annual revenue churn below 10%, with best-in-class firms achieving below 5%. Swiss software and technology businesses (SaaS models) typically target monthly churn below 1.5–2%, equivalent to approximately 18–24% annual churn — though this varies significantly by average contract value. Enterprise SaaS businesses with high contract values tend to have lower churn than SMB-focused SaaS products.
The Swiss commercial environment has specific factors that affect churn dynamics. Swiss businesses have a strong preference for established relationships and change-aversion in supplier decisions. This means that onboarding a new Swiss SME client typically requires a longer sales cycle than in other markets — but once the relationship is established, it is relatively sticky. Churn in Swiss B2B is often not caused by client dissatisfaction but by structural changes: M&A activity, regulatory changes, key contact turnover, or budget reallocation following a management change. Monitoring these early warning signals proactively — rather than responding reactively when a cancellation notice arrives — is the most effective churn reduction strategy.
The financial impact of churn reduction is nonlinear. Reducing annual churn from 15% to 10% on a CHF 1 million recurring revenue base does not merely save CHF 50,000 per year. It changes the long-term value of the business: a business with 10% churn has a customer lifetime of 10 years on average; one with 15% churn has a customer lifetime of 6.7 years. The compounding effect on business value is substantial, particularly in discounted cash flow valuations used by Swiss strategic buyers and private equity acquirers.
| Annual Revenue Churn | Average Customer Lifetime | Valuation Multiple Impact (SaaS/Recurring) |
|---|---|---|
| 5% | 20 years | High — premium multiples justified |
| 10% | 10 years | Moderate — market-standard multiples |
| 15% | 6.7 years | Discount applied — revenue quality concerns |
| 20%+ | 5 years or less | Significant discount — retention strategy required |
If your business has recurring revenues but does not currently track churn as a formal KPI, establishing that measurement is a high-priority step. A financial controlling engagement will typically surface churn as one of the first metrics to instrument and monitor.

Pascal Stämpfli leverages over a decade of expertise in corporate finance and venture capital to scale and optimize businesses. A CFA charterholder with a Master's in Economics from the University of St. Gallen, Pascal specializes in market & company assessments, strategy, and business value creation. Having assessed more than 1,000 companies for financial and strategic investors provides him with a sophisticated understanding of investor rationale and capital allocation. As the Managing Director of Scalemetrics and Managing Partner at COREangels Big Data & AI Europe, Pascal operates at the intersection of financial discipline and technological innovation.