
Predicting Future Revenues with Lead Velocity Rate (LVR)
Quick Answer
Learn how Lead Velocity Rate helps predict future revenue. Track leads, conversions, and improve sales strategies.
Understanding Lead Velocity Rate
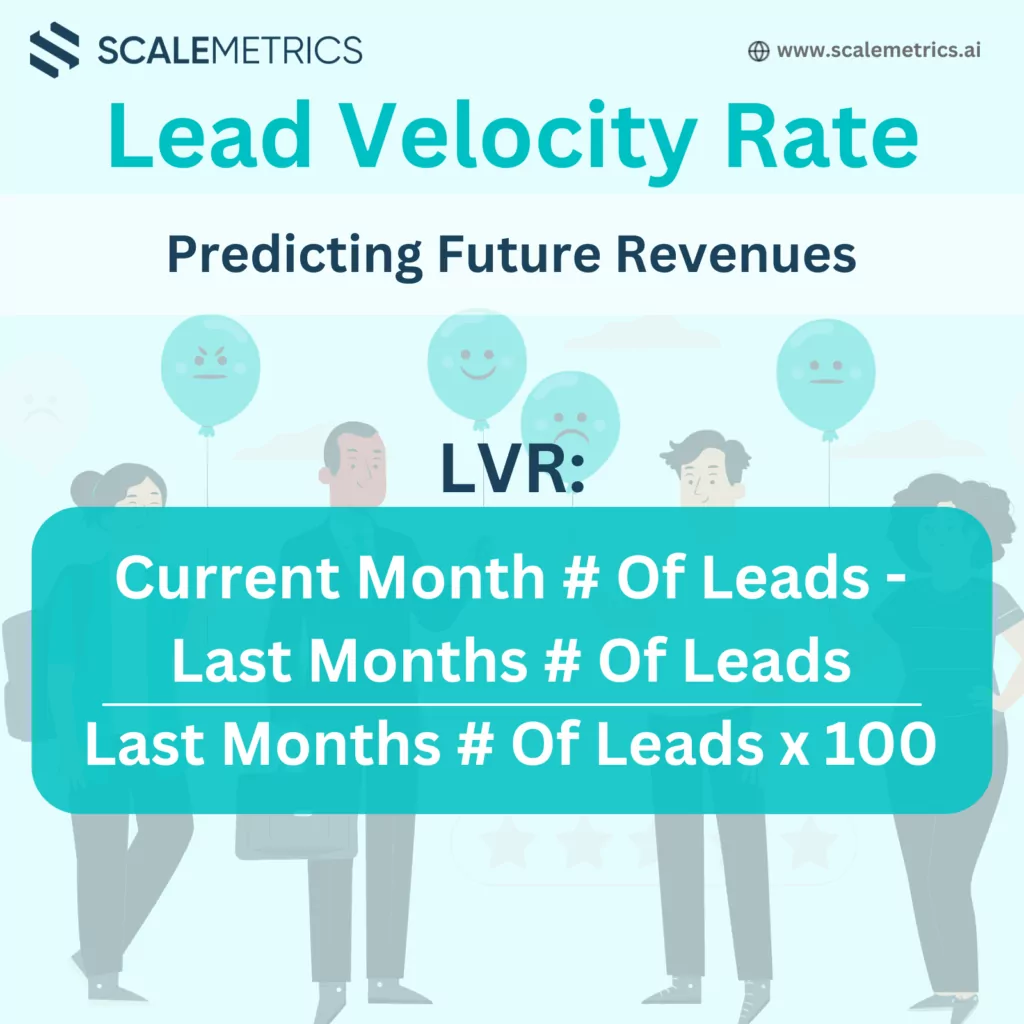
Lead Velocity Rate is a metric that measures the growth in the number of qualified leads from month to month. This KPI provides a forward-looking view of potential revenue by tracking how quickly new leads are generated and converted through the sales pipeline. By combining LVR with other key metrics such as marketing-qualified leads (MQL), sales-qualified leads (SQL), and the SQL-to-win ratio, startups can gain a clearer picture of their future revenue potential.Calculating Lead Velocity Rate
The formula to calculate LVR is straightforward: LVR=(Number of leads in the current month−Number of leads in the previous monthNumber of leads in the previous month)×100Practical Example: A SaaS Startup
Let’s consider a SaaS startup, “TechGrow,” to illustrate the application of LVR.- Month 1 Leads: 200
- Month 2 Leads: 250
Integrating LVR with Other Metrics
To enhance the reliability of revenue predictions, TechGrow combines LVR with the following metrics:- Marketing-Qualified Leads (MQL): Leads identified as more likely to become customers based on marketing efforts.
- Sales-Qualified Leads (SQL): MQLs that have been vetted by the sales team as ready for direct engagement.
- SQL-to-Win Ratio: The percentage of SQLs that successfully convert to paying customers.
Benefits of Using LVR
1. Improved Forecast Accuracy:- LVR provides a dynamic view of lead generation, enabling better short-term and long-term revenue forecasting.
- Regular tracking of LVR helps identify trends and adjust strategies in real-time.
- With reliable revenue predictions, TechGrow can make informed decisions regarding budgeting, resource allocation, and growth strategies.
- LVR helps in setting realistic sales targets and performance benchmarks.
- Investors seek startups with predictable and scalable revenue streams. Demonstrating a robust LVR can significantly boost investor confidence.
- Transparent and data-driven revenue projections attract more investment opportunities.
Challenges and Considerations
1. Market Dynamics:- LVR assumes that the market conditions and lead quality remain constant. Any significant changes in these factors can impact the accuracy of revenue predictions.
- Accurate LVR calculations depend on the quality and consistency of lead data. Ensuring reliable data collection and management practices is crucial.
- Effective LVR tracking requires seamless integration with Customer Relationship Management (CRM) systems. TechGrow must invest in robust CRM tools to streamline lead management.
Conclusion
Lead Velocity Rate is a powerful KPI that can help startups like TechGrow predict future revenues with greater reliability. By combining LVR with other key metrics, startups can gain valuable insights into their growth trajectory, enabling strategic decision-making and enhancing investor confidence. Implementing a data-driven approach to revenue forecasting is essential for navigating the complexities of startup growth and achieving long-term success. For those interested in deepening their understanding of revenue predictability or discussing the application of LVR further, feel free to reach out and connect with us.Related Resources
Scalemetrics helps Swiss SMEs act on decisions like this before market conditions shift. Our company valuation services and outsourced CFO team give finance directors the senior expertise to move first.
Sources & References
Frequently Asked Questions
What financial services does Scalemetrics provide for Swiss SMEs?
Scalemetrics provides Swiss SME owners and CFOs with practical financial expertise: from accounting and tax compliance to financial planning, KPI monitoring, and on-demand CFO services, giving growing businesses access to senior financial leadership without a full-time hire.
When does a Swiss SME need a fractional CFO?
A fractional CFO becomes valuable from around CHF 1–2M in annual revenue, or ahead of specific events: bank financing applications, investor rounds, M&A, or rapid growth phases. The cost is a fraction of a full-time CFO salary, with expertise available immediately.
How does Scalemetrics differ from a traditional Swiss fiduciary firm?
Traditional fiduciary firms focus on tax compliance and year-end accounts. Scalemetrics adds strategic financial leadership: rolling forecasts, cash flow modelling, KPI dashboards, and financing advisory, delivered as an ongoing mandate or for a specific project.
Which Swiss cantons does Scalemetrics cover?
Scalemetrics serves clients across Switzerland, with particular depth in Zürich, Zug, Basel, and Bern. Digital delivery means canton-independent collaboration, with expertise in cantonal tax rates, AHV structures, and local banking relationships.
How much does a fractional CFO engagement cost in Switzerland?
Pricing depends on scope and frequency. Typical SME engagements start from CHF 1’500–3’000 per month for a core package and scale with business complexity. An initial consultation is free of charge.
What Is Lead Velocity Rate and Why Does It Predict Revenue?
Lead velocity rate (LVR) measures the month-on-month percentage growth in the number of qualified leads entering your pipeline. Unlike metrics that look backwards at revenue already recognised, LVR is a leading indicator — it tells you what your revenue will look like in three to six months, before the outcome is visible in your P&L.
The logic is straightforward: if your conversion rate and average sales cycle are stable, the volume of qualified leads this month predicts the volume of new customers you will close in future months with reasonable precision. A positive LVR of 10% per month means your pipeline is growing at a compound rate that, if sustained, will drive meaningful ARR acceleration within two quarters. A flat or negative LVR signals a future revenue shortfall — well before it appears in your reporting.
For Swiss SMEs building investor-ready financial models, LVR is one of the most compelling data points you can present. It demonstrates that growth is systematic and pipeline-driven rather than dependent on opportunistic deal flow. Swiss institutional investors and growth lenders — including PostFinance's SME financing arm and major cantonal bank credit committees — are increasingly sophisticated in evaluating whether a company's revenue trajectory is durable or fragile.
Calculating and Interpreting LVR for Swiss SMEs
LVR is calculated as: ((Qualified Leads This Month − Qualified Leads Last Month) ÷ Qualified Leads Last Month) × 100. The critical term is "qualified leads" — not raw website visitors, MQLs, or contact form submissions, but prospects who have been assessed by your sales team and confirmed to meet your ideal customer profile criteria.
A consistently positive LVR of 5–15% per month is a strong signal of scalable growth. Below 5% suggests either market saturation or underinvestment in lead generation. Above 20% per month is possible in early growth phases but difficult to sustain, and may reflect unsustainable marketing spend rather than organic pipeline development.
In the Swiss context, LVR must be interpreted with awareness of seasonal patterns. Swiss business activity slows materially during the Bundesferien (August holiday period), the Christmas–New Year break, and around key cantonal and national holidays. A negative LVR in August is rarely a signal of structural pipeline weakness; a negative LVR in March or October is more concerning and warrants investigation.
Fully-loaded marketing cost must be tracked alongside LVR to assess capital efficiency. If your LVR is growing at 10% per month but your marketing spend (including AHV-loaded personnel costs, paid media, and event costs) is growing at 20% per month, your cost per qualified lead is rising — a warning sign that growth is becoming less capital-efficient over time.
LVR as Part of a Predictive Revenue Framework
LVR reaches its full analytical power when combined with average sales cycle data and conversion rates. By modelling future revenue as a function of current LVR, you can generate rolling three and six-month revenue projections that are grounded in pipeline data rather than aspirational targets.
| Monthly LVR | 6-Month Pipeline Growth | Signal |
|---|---|---|
| < 0% | Shrinking | Revenue decline risk — investigate immediately |
| 0–5% | +0–34% | Slow growth — review lead generation strategy |
| 5–15% | +34–140% | Healthy, scalable growth trajectory |
| > 20% | > +200% | Rapid growth — monitor CAC and conversion quality |
To build a predictive revenue model using LVR and pipeline data for your Swiss SME, our financial planning team can design the forecasting framework that turns your pipeline metrics into reliable revenue projections.

Pascal Stämpfli leverages over a decade of expertise in corporate finance and venture capital to scale and optimize businesses. A CFA charterholder with a Master's in Economics from the University of St. Gallen, Pascal specializes in market & company assessments, strategy, and business value creation. Having assessed more than 1,000 companies for financial and strategic investors provides him with a sophisticated understanding of investor rationale and capital allocation. As the Managing Director of Scalemetrics and Managing Partner at COREangels Big Data & AI Europe, Pascal operates at the intersection of financial discipline and technological innovation.