
Understanding the LTV to CAC ratio: A key to startup success
Quick Answer
Learn how to use the LTV to CAC ratio to evaluate your company's performance and guide growth strategies effectively.
What is the CLV to CAC Ratio?
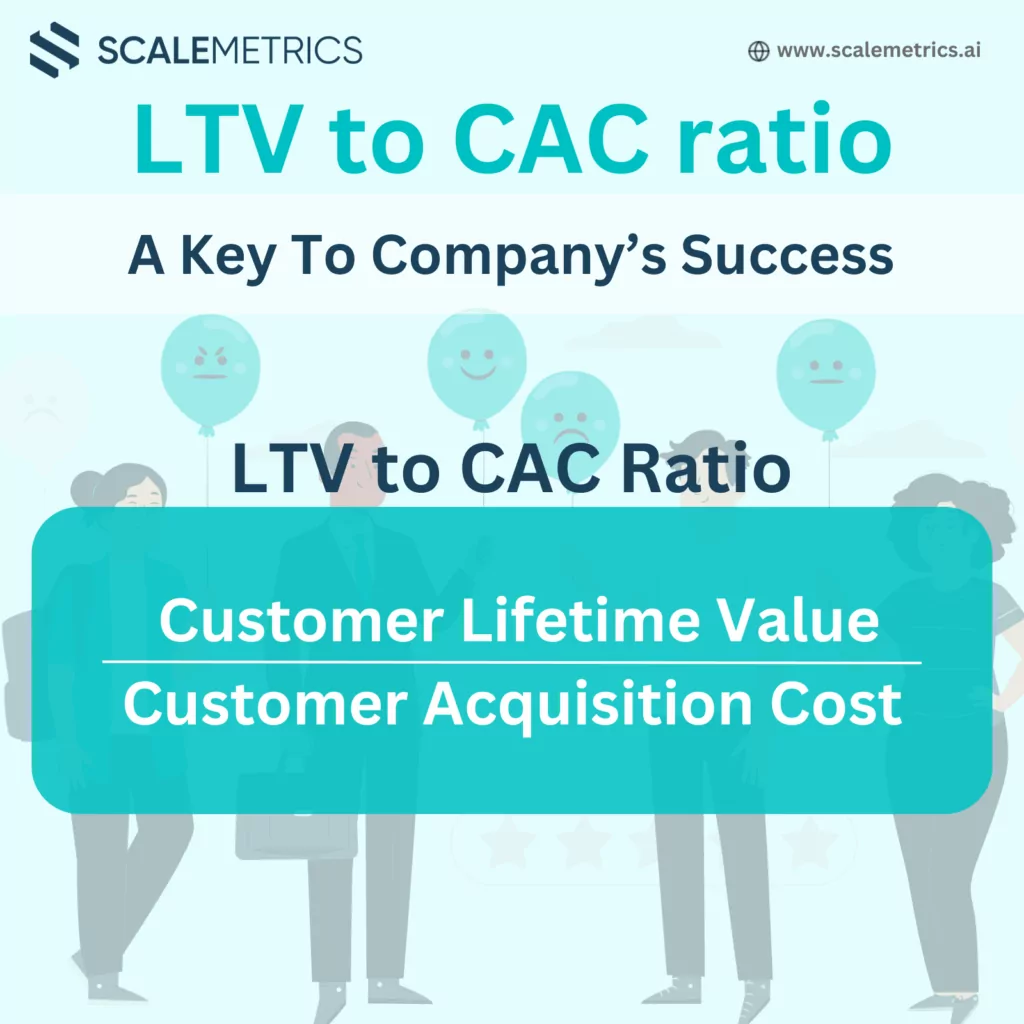
The CLV represents the total gross profit expected from a single customer account over its entire lifespan, while the CAC is the cost incurred to acquire that specific customer. The CLV to CAC ratio shows the value generated from customers relative to the acquisition cost, helping businesses assess the efficiency and scalability of their operations.Key Ratios and Actions
- LTV to CAC Ratio >3:
- Action: Accelerate marketing and sales efforts.
- Reason: Your business model is scalable with a high ROI. Investing more in customer acquisition will likely yield substantial returns and profit. A ratio greater than 3 suggests that the company is efficiently acquiring and retaining profitable customers.
- LTV to CAC Ratio =3:
- Action: Maintain current strategies and focus on product enhancements for sustainable growth.
- Reason: A balanced and sustainable business model. Consider refining your product or service offerings to increase customer satisfaction and loyalty.
- LTV to CAC Ratio <3:
- Action: Immediate improvement is needed. Enhance your product/service and target more profitable customer segments.
- Reason: Reducing customer acquisition costs through more efficient marketing and sales strategies is essential. A ratio less than 3 suggests that the company may be spending too much on customer acquisition relative to the value generated.
Optimizing the LTV to CAC Ratio
- Improve Customer Retention:
- Strategy: Implement loyalty programs, personalized communication, and proactive support.
- Outcome: Enhances customer retention, increases LTV, and reduces churn, thereby improving the overall value of each customer.
- Optimize Marketing Strategies:
- Strategy: Focus on high-ROI marketing channels and campaigns. Use data analytics to identify the most effective strategies for acquiring customers.
- Outcome: Ensures targeting the right audience and maximizing returns on marketing spend.
- Enhance Customer Onboarding:
- Strategy: Streamline the onboarding process to ensure new customers quickly realize the value of your product.
- Outcome: A positive onboarding experience leads to higher retention rates and increased LTV.
- Monitor and Adjust:
- Strategy: Regularly monitor your LTV to CAC ratio and adjust strategies as needed. Use financial analytics tools for insights.
- Outcome: Continuous monitoring helps identify trends and areas for improvement, ensuring the company remains on track to achieve its goals.
Real-World Examples
Spotify
Spotify, the music streaming giant, optimizes its LTV to CAC ratio by focusing on customer retention through personalized playlists, regular updates, and targeted marketing campaigns. By maintaining a high LTV and efficient CAC, Spotify ensures sustainable growth and profitability. Spotify’s focus on customer experience and data-driven marketing has contributed to its success and market dominance.Salesforce
Salesforce, a leading CRM platform, invests heavily in customer success programs and personalized support to ensure customers derive maximum value from their products. This focus on customer success has resulted in high retention rates and a favorable LTV to CAC ratio, driving long-term growth and profitability.Additional Strategies for Optimizing LTV to CAC Ratio
- Upselling and Cross-Selling:
- Strategy: Implement strategies to upsell and cross-sell to existing customers by offering complementary products or services.
- Example: An e-commerce company recommending related products based on a customer’s previous purchases.
- Customer Segmentation:
- Strategy: Tailor marketing efforts and product offerings to specific customer groups.
- Example: A SaaS company segmenting customers based on usage patterns and offering targeted promotions to high-value users.
- Customer Journey Mapping:
- Strategy: Identify touchpoints to enhance the customer experience throughout their lifecycle.
- Outcome: Improves satisfaction and loyalty by optimizing interactions from initial contact to post-purchase support.
- Predictive Analytics:
- Strategy: Use predictive analytics to identify patterns and trends in customer behavior.
- Example: A subscription-based service identifying customers at risk of churn and offering targeted incentives to retain them.
- Personalized Marketing:
- Strategy: Create personalized marketing campaigns using data insights.
- Example: An online retailer using purchase history and browsing behavior to send personalized product recommendations and offers.
Conclusion
The CLV to CAC ratio is a vital metric for assessing the health and efficiency of your business model. By focusing on strategies that enhance customer retention, optimize marketing efforts, and improve the overall customer experience, companies can achieve a favorable LTV to CAC ratio that drives sustainable growth and profitability. Continuous monitoring and adjustment of these strategies based on data insights will ensure that your business remains competitive and successful in the long run.Related Resources
Scalemetrics helps Swiss SMEs act on decisions like this before market conditions shift. Our financial due diligence services and outsourced CFO team give finance directors the senior expertise to move first.
Sources & References
Frequently Asked Questions
What financial services does Scalemetrics provide for Swiss SMEs?
Scalemetrics provides Swiss SME owners and CFOs with practical financial expertise: from accounting and tax compliance to financial planning, KPI monitoring, and on-demand CFO services. The goal is to give growing businesses access to senior financial leadership without the cost of a full-time hire.
When does a Swiss SME need a fractional CFO?
A fractional CFO becomes valuable from around CHF 1–2M in annual revenue, or ahead of specific events: bank financing applications, investor rounds, M&A, or rapid growth phases. The cost is a fraction of a full-time CFO salary, with expertise available immediately.
How does Scalemetrics differ from a traditional Swiss fiduciary firm?
Traditional fiduciary firms focus on tax compliance and year-end accounts. Scalemetrics adds strategic financial leadership: rolling forecasts, cash flow modelling, KPI dashboards, and financing advisory, delivered as an ongoing mandate or for a specific project.
Which Swiss cantons does Scalemetrics cover?
Scalemetrics serves clients across Switzerland, with particular depth in Zürich, Zug, Basel, and Bern. Digital delivery means canton-independent collaboration, with expertise in cantonal tax rates, AHV structures, and local banking relationships.
LTV to CAC: The Metric That Defines Scalable Growth
The ratio of Customer Lifetime Value (LTV) to Customer Acquisition Cost (CAC) is arguably the single most important metric for any Swiss SME operating a recurring revenue or relationship-based business model. It answers a fundamental question: for every franc spent acquiring a customer, how many francs does the business earn over the life of that relationship? A ratio above 3:1 is conventionally considered healthy; below 1:1 means the business is destroying value with every customer it acquires.
Swiss SMEs frequently struggle with LTV:CAC not because the concept is unclear but because the inputs required to calculate it accurately are dispersed across systems that are not designed to talk to each other. Customer acquisition costs require a rigorous allocation of all sales and marketing expenditure — including the fully loaded cost of sales staff (salary plus AHV employer contributions of 5.3%, BVG contributions of 8–12%, and other employment costs) — to the customers acquired in a given period. Lifetime value requires accurate gross margin data and reliable churn or retention rate measurement.
The investment case for improving LTV:CAC is compelling. A business that increases its LTV:CAC from 2:1 to 4:1 — either by improving retention, increasing average contract value, or reducing acquisition costs — has effectively doubled the financial return from its growth investment without changing its revenue trajectory. For Swiss SMEs in competitive markets where price competition is intense, improving LTV:CAC through retention and expansion is often a more achievable path to financial improvement than winning the price battle for new customers.
Calculating LTV:CAC for Your Swiss SME
The calculation framework is straightforward, but accuracy depends on the quality of the underlying data:
- CAC: Total sales and marketing expenditure in a period, divided by the number of new customers acquired in that period. For a Swiss SME spending CHF 300,000 annually on sales and marketing and acquiring 50 new customers, CAC = CHF 6,000.
- LTV: Average annual contract value multiplied by gross margin percentage, divided by churn rate. For a business with CHF 24,000 average contract value, 60% gross margin, and 20% annual churn: LTV = (24,000 × 0.60) / 0.20 = CHF 72,000.
- LTV:CAC ratio: CHF 72,000 / CHF 6,000 = 12:1 — an excellent ratio indicating strong unit economics.
- CAC payback period: CAC divided by (average monthly revenue per customer × gross margin). Using the same example: 6,000 / (2,000 × 0.60) = 5 months — healthy for a B2B SaaS or services business.
LTV:CAC Benchmarks by Business Model
| Business Model | Healthy LTV:CAC | Target CAC Payback | Key Driver |
|---|---|---|---|
| SaaS / Recurring software | 3:1 – 8:1 | <18 months | Retention / NRR |
| Professional services | 4:1 – 10:1 | <12 months | Margin & account growth |
| B2B products | 3:1 – 6:1 | <24 months | Gross margin |
| Distribution / reselling | 2:1 – 4:1 | <12 months | Volume efficiency |
Understanding and actively managing your LTV:CAC ratio is a core element of the financial framework we implement through our financial controlling service — helping Swiss SMEs make growth investment decisions on the basis of unit economics that actually hold up to scrutiny.

Pascal Stämpfli leverages over a decade of expertise in corporate finance and venture capital to scale and optimize businesses. A CFA charterholder with a Master's in Economics from the University of St. Gallen, Pascal specializes in market & company assessments, strategy, and business value creation. Having assessed more than 1,000 companies for financial and strategic investors provides him with a sophisticated understanding of investor rationale and capital allocation. As the Managing Director of Scalemetrics and Managing Partner at COREangels Big Data & AI Europe, Pascal operates at the intersection of financial discipline and technological innovation.