
KPIs for Navigating Your Company’s Growth Stage : The CLV to CAC Ratio
Quick Answer
CLV:CAC below 3 means your growth engine is inefficient. How to calculate, interpret, and improve your LTV/CAC ratio – benchmarks, Swiss SaaS context, and CFO red flags.
As we kick off the year, it’s time to focus on one of the most critical KPIs for driving sustainable growth: the Customer Lifetime Value (CLV) to Customer Acquisition Cost (CAC) Ratio. This powerful metric offers insight into how effectively your company is acquiring customers relative to the revenue they generate over their lifetime.
What is the CLV to CAC Ratio?
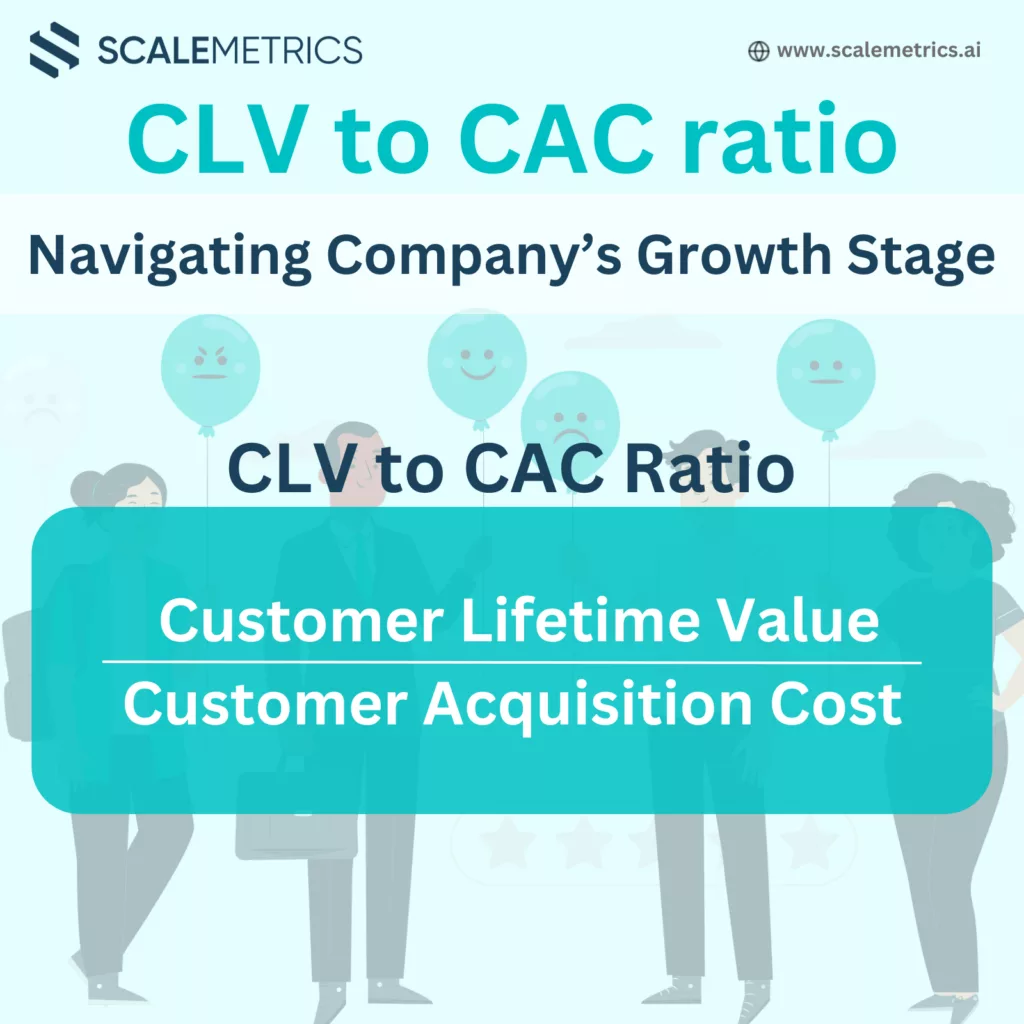
The CLV to CAC Ratio compares the revenue earned from a customer over their lifetime (CLV) to the cost of acquiring that customer (CAC). It’s a clear measure of how cost-efficient and scalable your customer acquisition efforts are.
Why is the CLV to CAC Ratio Important?
This ratio is a key indicator of business health and profitability. Here’s why:
1. Determines Cost Efficiency
A high CLV to CAC ratio shows that your company is generating significantly more revenue from customers than it costs to acquire them, leading to sustainable growth.
2. Highlights Scalability
As you scale your business, acquisition costs often increase. Tracking this ratio ensures your growth strategies remain viable over time.
3. Signals Profitability
This metric reveals whether your business model is profitable or needs adjustments to achieve long-term success.
How to Calculate the CLV to CAC Ratio
The formula for this KPI is straightforward:
CLV to CAC Ratio = Customer Lifetime Value (CLV) / Customer Acquisition Cost (CAC)
Example Calculation
Let’s say:
- Customer Lifetime Value (CLV): $1,200
- Customer Acquisition Cost (CAC): $400
CLV to CAC Ratio = $1,200 / $400 = 3:1
A 3:1 ratio is considered healthy, meaning that for every dollar spent acquiring a customer, your business earns three dollars in return.
What Does Your Ratio Tell You?
Healthy Ratio (3:1 or Higher):
Indicates strong customer acquisition efficiency. Your marketing and sales efforts are driving sustainable profits.
Low Ratio (Below 3:1):
Suggests that acquisition costs are too high or CLV is too low. This requires refining acquisition strategies, reducing churn, or increasing customer spending.
Overly High Ratio (Above 5:1):
While a high ratio may seem positive, it could indicate that you’re under-investing in acquisition efforts, potentially missing out on growth opportunities.
Actionable Insights to Improve Your CLV to CAC Ratio
To maintain or improve this critical KPI, focus on both increasing CLV and reducing CAC. Here’s how:
1. Optimize Marketing and Sales Strategies
- Invest in performance marketing to attract the right audience.
- Focus on organic acquisition channels, such as SEO and referrals, to lower costs.
- Streamline sales processes to reduce the time and expense of closing deals.
2. Enhance Customer Experience
Happy customers are loyal customers. Prioritize customer satisfaction to increase retention and lifetime value.
- Provide exceptional post-sale support.
- Use personalized communication to foster stronger relationships.
- Actively collect and act on customer feedback.
3. Increase Upselling and Cross-Selling
Maximize revenue per customer by offering complementary products or premium services.
- Identify opportunities for upselling (e.g., premium plans, upgrades).
- Cross-sell relevant products to boost customer spending.
4. Refine Customer Segmentation
Target customers with the highest potential lifetime value.
- Use data to segment customers by behavior, demographics, or profitability.
- Focus acquisition efforts on segments with a history of high retention and spending.
5. Minimize Churn
High customer churn reduces CLV and negatively impacts your ratio.
- Implement retention strategies like loyalty programs or proactive support.
- Monitor churn drivers and address recurring issues.
Benchmarking Your CLV to CAC Ratio
While a 3:1 ratio is considered healthy across most industries, benchmarks vary:
| Industry | Ideal Ratio |
|---|---|
| SaaS (B2B) | 3:1 to 5:1 |
| E-commerce | 2:1 to 4:1 |
| Consumer Goods | 2:1 to 3:1 |
| Financial Services | 4:1 to 6:1 |
Tracking your ratio against industry standards provides valuable insight into your performance and areas for improvement.
Why the CLV to CAC Ratio Matters for Growth-Stage Companies
At the growth stage, scaling efficiently is critical. The CLV to CAC ratio ensures you:
- Allocate resources effectively between customer acquisition and retention.
- Identify areas of inefficiency in your marketing and sales processes.
- Build a business model that is both scalable and profitable.
Are Your Acquisition Efforts Driving Sustainable Growth?
Tracking and optimizing your CLV to CAC ratio is essential for achieving long-term success. Start by calculating your current ratio, benchmarking it against industry standards, and implementing actionable strategies to improve it.!
What a healthy CLV to CAC ratio tells a Swiss SME
A CLV to CAC ratio near 3 to 1 usually signals that acquisition spend is paying back efficiently, while a very high ratio can mean you are underinvesting in growth. The number only helps if you review it every month against churn and payback period. Scalemetrics tracks CLV to CAC and the metrics behind it through business monitoring and controlling for Swiss SMEs.
Related Resources
Scalemetrics helps Swiss SMEs act on decisions like this before market conditions shift. Our financial due diligence services and outsourced CFO team give finance directors the senior expertise to move first.
Sources & References
CLV to CAC Ratio: The Swiss SME Growth Quality Test
The ratio of Customer Lifetime Value (CLV) to Customer Acquisition Cost (CAC) is one of the most powerful single metrics for assessing the quality and sustainability of a Swiss SME's growth. It answers a fundamental question: for every franc spent acquiring a customer, how many francs of lifetime value does that customer return? A business with a CLV:CAC ratio below 3:1 is likely spending too much to acquire customers relative to what those customers are worth. A ratio above 5:1 may indicate an underinvestment in marketing and sales that is leaving growth opportunities uncaptured.
Customer Lifetime Value is calculated as: average annual revenue per customer × gross margin percentage × average customer lifetime in years. For a Swiss B2B professional services firm with an average annual retainer of CHF 24,000, a gross margin of 60%, and an average client relationship of 4 years, the CLV is CHF 24,000 × 0.60 × 4 = CHF 57,600 per client.
Customer Acquisition Cost is the total sales and marketing spend (including staff time, events, advertising, and referral commissions) divided by the number of new clients acquired in the same period. If a Swiss SME spent CHF 180,000 on sales and marketing in a year and acquired 15 new clients, the CAC is CHF 12,000 per client. With the CLV of CHF 57,600, the CLV:CAC ratio is 4.8:1 — a healthy position indicating that growth investment is generating strong returns.
Swiss Market Factors That Affect CLV:CAC
The Swiss B2B sales cycle is characteristically longer than in most comparable markets. Trust-building, reference checking, and committee-based procurement decisions mean that a new enterprise client in Switzerland may take 6–18 months from first contact to signed contract. This elongated sales cycle inflates CAC relative to markets where sales cycles are 1–3 months. Swiss SMEs must therefore either accept higher CAC as a structural feature of the market, or invest in referral networks and introductions that compress the cycle by establishing trust earlier in the relationship.
Retention rate has an outsized effect on CLV in the Swiss context. Increasing average client lifetime from 4 to 5 years — achievable through systematic client management, regular strategic reviews, and proactive service extension — increases CLV by 25% without any change in contract value or margin. In the above example, a 5-year average lifetime increases CLV to CHF 72,000, improving the ratio to 6:1. This illustrates why client retention investment often generates better returns than equivalent new client acquisition spend in Switzerland.
BVG pension contributions and AHV charges on the sales team's compensation form part of the true CAC calculation. A Swiss sales executive earning CHF 120,000 costs approximately CHF 138,000–144,000 all-in including employer social charges. If that executive closes 8 new clients per year, their fully loaded cost per client closed is CHF 17,250–18,000. Adding marketing spend, event costs, and management time typically brings total CAC to CHF 20,000–25,000 for enterprise-level Swiss B2B sales — far higher than naive calculations based on direct marketing spend alone.
| CLV:CAC Ratio | Interpretation | Swiss SME Action |
|---|---|---|
| Below 2:1 | Unsustainable — acquiring clients at a loss | Urgent: reduce CAC or increase retention/pricing |
| 2:1 – 3:1 | Marginal — needs improvement | Optimise sales mix and client quality |
| 3:1 – 5:1 | Healthy — growth investment justified | Maintain and monitor by segment |
| Above 5:1 | Strong — potential underinvestment in growth | Consider increasing sales/marketing investment |
Calculating and tracking your CLV:CAC ratio requires an integrated view of your marketing spend, sales costs, and client retention data. A financial controlling partner helps Swiss SMEs build the data infrastructure to produce this metric reliably and use it to inform investment decisions.

Pascal Stämpfli leverages over a decade of expertise in corporate finance and venture capital to scale and optimize businesses. A CFA charterholder with a Master's in Economics from the University of St. Gallen, Pascal specializes in market & company assessments, strategy, and business value creation. Having assessed more than 1,000 companies for financial and strategic investors provides him with a sophisticated understanding of investor rationale and capital allocation. As the Managing Director of Scalemetrics and Managing Partner at COREangels Big Data & AI Europe, Pascal operates at the intersection of financial discipline and technological innovation.