
Increase the Scalability of Your Business by Assessing Your Cost Per Lead (CPL)
Quick Answer
Increase the scalability of your business by assessing your cost per lead (CPL) and grow your startup faster like never before
Understanding Cost Per Lead (CPL)
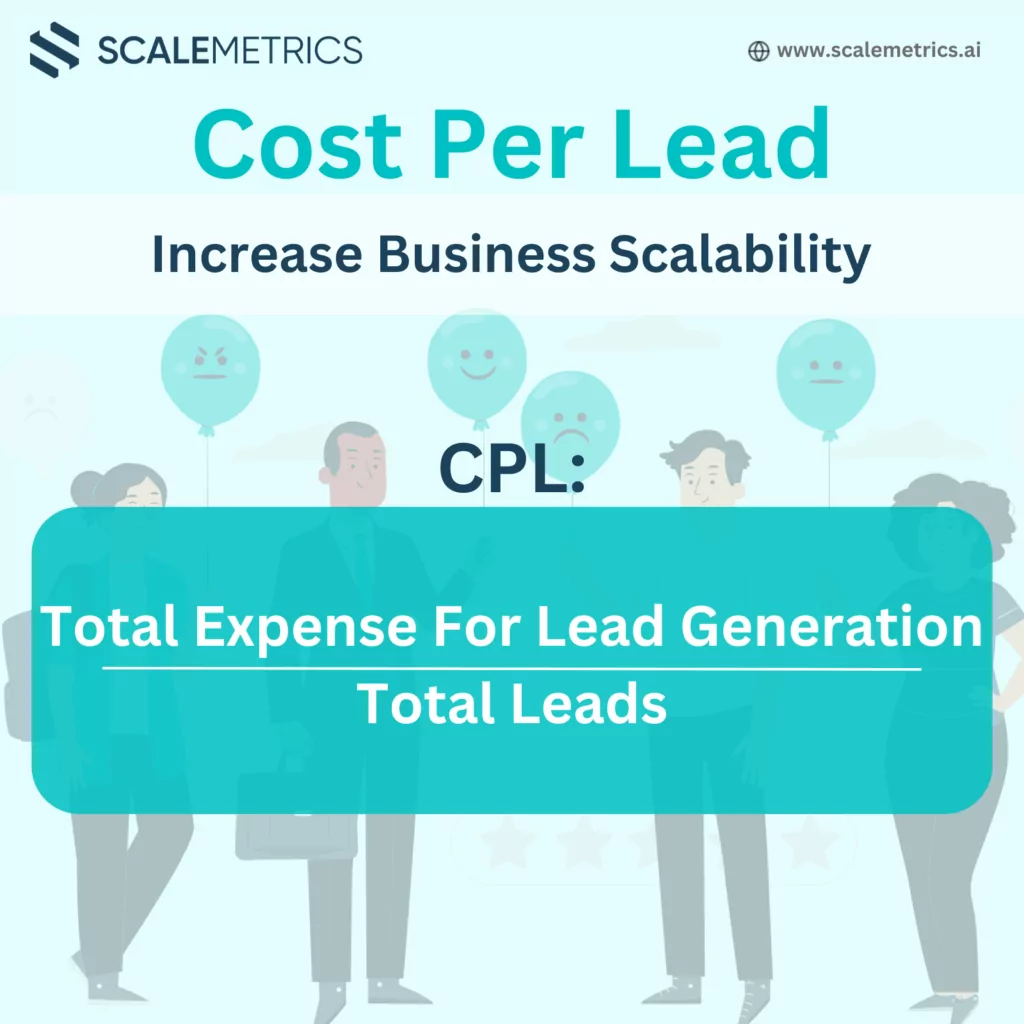
Cost Per Lead (CPL) is a marketing metric that measures the cost-effectiveness of your marketing campaigns in generating new leads. It is calculated by dividing the total marketing spend by the number of leads generated. CPL=Total Marketing Spend/Number of Leads GeneratedSteps to Assess Your Cost Per Lead
1. Classify Your Leads
Start by classifying your leads based on their source or type. Common lead classifications include:- Raw Leads: Initial contacts with no qualification.
- Referral Leads: Leads referred by existing customers.
- Marketing Leads: Leads generated from marketing campaigns.
- Sales Leads: Leads generated by the sales team.
- Marketing Qualified Leads (MQLs): Leads deemed more likely to become customers based on marketing criteria.
- Sales Qualified Leads (SQLs): Leads vetted by sales and deemed ready for a direct sales follow-up.
2. Allocate Resources
Allocate both human and financial resources spent on generating each set or single specific lead. This includes:- Human Resources: Time and effort of marketing and sales teams.
- Financial Resources: Money spent on campaigns, tools, and advertising.
3. Track Leads Through the Sales Funnel
Track your classified leads throughout the entire sales funnel. This tracking should reflect the quality of the leads by monitoring:- Lead Conversion Rates: Percentage of leads that convert to customers.
- Lead Engagement: Level of interaction and interest shown by the lead.
- Lead Source Effectiveness: Performance of different lead sources in generating quality leads.
Benefits of Tracking CPL
Tracking and retrieving the above information demonstrates the scalability of your business to yourself, your team, and investors. The benefits include:- Optimized Resource Allocation:
- Efficient allocation of marketing and sales resources based on lead performance.
- Focus on high-performing channels that generate the most cost-effective leads.
- Improved Marketing Strategies:
- Identify which marketing channels provide the best return on investment.
- Adjust marketing strategies based on lead quality and conversion rates.
- Enhanced Sales Efficiency:
- Streamline sales processes by focusing on high-quality leads.
- Reduce the time and cost associated with converting leads to customers.
- Better Decision Making:
- Make data-driven decisions to scale your business.
- Quickly see the impact of any changes in your marketing and sales efforts.
Example: Implementing CPL Assessment
Consider a SaaS company that runs multiple marketing campaigns, including Google Ads, content marketing, and email marketing. By classifying leads from each campaign and tracking their journey through the sales funnel, the company can:- Calculate the CPL for each campaign.
- Identify which campaigns generate the highest quality leads at the lowest cost.
- Allocate more budget to the most cost-effective campaigns.
- Improve overall marketing efficiency and scalability.
Conclusion
By accurately assessing and optimizing your Cost Per Lead (CPL), you can significantly enhance the scalability of your business. This metric helps you understand the cost-effectiveness of your lead generation efforts and enables you to allocate resources more efficiently. Tracking CPL provides insights that guide strategic decisions, leading to improved marketing performance and business growth.Related Resources
Scalemetrics helps Swiss SMEs act on decisions like this before market conditions shift. Our budgeting and financial forecasting services and outsourced CFO team give finance directors the senior expertise to move first.
Sources & References
Frequently Asked Questions
What financial services does Scalemetrics provide for Swiss SMEs?
Scalemetrics provides Swiss SME owners and CFOs with practical financial expertise: from accounting and tax compliance to financial planning, KPI monitoring, and on-demand CFO services. The goal is to give growing businesses access to senior financial leadership without the cost of a full-time hire.
When does a Swiss SME need a fractional CFO?
A fractional CFO becomes valuable from around CHF 1–2M in annual revenue, or ahead of specific events: bank financing applications, investor rounds, M&A, or rapid growth phases. The cost is a fraction of a full-time CFO salary, with expertise available immediately.
How does Scalemetrics differ from a traditional Swiss fiduciary firm?
Traditional fiduciary firms focus on tax compliance and year-end accounts. Scalemetrics adds strategic financial leadership: rolling forecasts, cash flow modelling, KPI dashboards, and financing advisory, delivered as an ongoing mandate or for a specific project.
Which Swiss cantons does Scalemetrics cover?
Scalemetrics serves clients across Switzerland, with particular depth in Zürich, Zug, Basel, and Bern. Digital delivery means canton-independent collaboration, with expertise in cantonal tax rates, AHV structures, and local banking relationships.
What financial documents do Swiss investors and banks require?
Swiss investors and banks typically require three years of OR-compliant financial statements, a 3–5 year financial model, a 13-week cash flow forecast, a cap table, and KPI dashboards. Series A investors additionally expect audited accounts and unit economics. Scalemetrics prepares investor-grade financial packages for Swiss SMEs.
How does a fractional CFO help Swiss SMEs raise financing?
A fractional CFO improves Swiss SME financing outcomes by building the financial model, preparing OR-compliant statements, structuring the data room, and presenting financials credibly to banks or investors. SMEs with a proper finance function secure better terms and faster credit decisions. Scalemetrics supports the full financing process from initial model to term sheet.
Cost Per Lead: The Upstream Driver of Sales Efficiency
Cost per lead (CPL) is the metric that sits upstream of customer acquisition cost. Where CAC measures the total investment to convert a prospect into a customer, CPL measures the cost of generating a sales-qualified opportunity in the first place. For Swiss SMEs building scalable sales pipelines, CPL determines the volume and quality of opportunities entering the funnel — and therefore the maximum throughput of the entire revenue engine.
The relationship between CPL, lead quality, and CAC is multiplicative. A low CPL achieved through broad, untargeted campaigns often produces leads with poor conversion rates, driving CAC higher even as the cost-per-lead falls. Conversely, a higher CPL from targeted account-based marketing or specialist referral networks may produce leads that convert at two or three times the rate, materially reducing CAC and improving the overall economics of growth.
For Swiss B2B SMEs, where the addressable market is smaller than in larger economies and relationship-based trust carries disproportionate weight, lead quality is generally more important than lead volume. A Swiss industrial SME generating 20 highly-qualified leads per month at CHF 400 each is in a stronger position than one generating 200 low-quality leads at CHF 40 each — if the conversion rate difference is significant.
Calculating True CPL in the Swiss Context
Accurate CPL calculation requires the same discipline as accurate CAC calculation. It must include all costs attributable to lead generation: content creation, paid media, event participation, social selling tools, and the proportional cost of marketing personnel — including AHV employer contributions at 5.3%, BVG pension contributions at 8–12% of insured salary, and any SUVA/UVG accident insurance allocations.
Swiss marketing professionals command premium salaries relative to most European markets. A senior demand generation manager in Zurich or Zug earns CHF 100,000–130,000 base salary; fully loaded, this represents CHF 115,000–150,000 of employer cost. Attributing this cost accurately across all lead-generating activities is essential to understanding which channels are genuinely cost-effective and which merely appear cheap on a media-spend-only basis.
MWST (VAT) at 8.1% on marketing services and advertising is recoverable for full VAT taxpayers, which reduces the net CPL for businesses correctly accounting for input tax. This can make a meaningful difference when comparing channel costs at scale — particularly for SMEs with significant digital advertising budgets.
Using CPL Data to Improve Scalability
The strategic value of CPL data lies in its ability to guide channel investment decisions. By tracking CPL and downstream conversion rates by channel, Swiss SMEs can model the marginal cost of adding a new unit of pipeline — and make rational decisions about where to increase investment to generate scalable growth.
| Channel | Typical CPL Range (Swiss B2B) | Typical Conversion to Customer |
|---|---|---|
| Referral / Word of Mouth | CHF 50–200 | 25–40% |
| Organic Search (SEO) | CHF 100–400 | 10–20% |
| Paid Search (Google Ads) | CHF 150–600 | 5–15% |
| LinkedIn / Social Ads | CHF 200–800 | 5–12% |
| Events / Trade Shows | CHF 300–1,200 | 15–30% |
To build a CPL tracking framework and integrate it with your CAC and CLV modelling, our financial controlling services provide the analytical infrastructure your Swiss SME needs to scale with confidence.

Pascal Stämpfli leverages over a decade of expertise in corporate finance and venture capital to scale and optimize businesses. A CFA charterholder with a Master's in Economics from the University of St. Gallen, Pascal specializes in market & company assessments, strategy, and business value creation. Having assessed more than 1,000 companies for financial and strategic investors provides him with a sophisticated understanding of investor rationale and capital allocation. As the Managing Director of Scalemetrics and Managing Partner at COREangels Big Data & AI Europe, Pascal operates at the intersection of financial discipline and technological innovation.