
Understanding and Optimizing Average Sales Cycle
Quick Answer
Learn how to calculate and optimize your average sales cycle to enhance sales efficiency and predict revenue accurately.
Importance of Average Sales Cycle
The average sales cycle is a critical metric for several reasons:- Revenue Prediction: Knowing the average time it takes to close a deal helps in forecasting when revenue will be realized.
- Sales Process Efficiency: A shorter sales cycle indicates a more efficient sales process.
- Resource Allocation: Helps in planning and allocating resources more effectively.
- Market Insights: Benchmarking against industry standards can reveal the quality of your sales process and product-market fit.
Calculating Average Sales Cycle
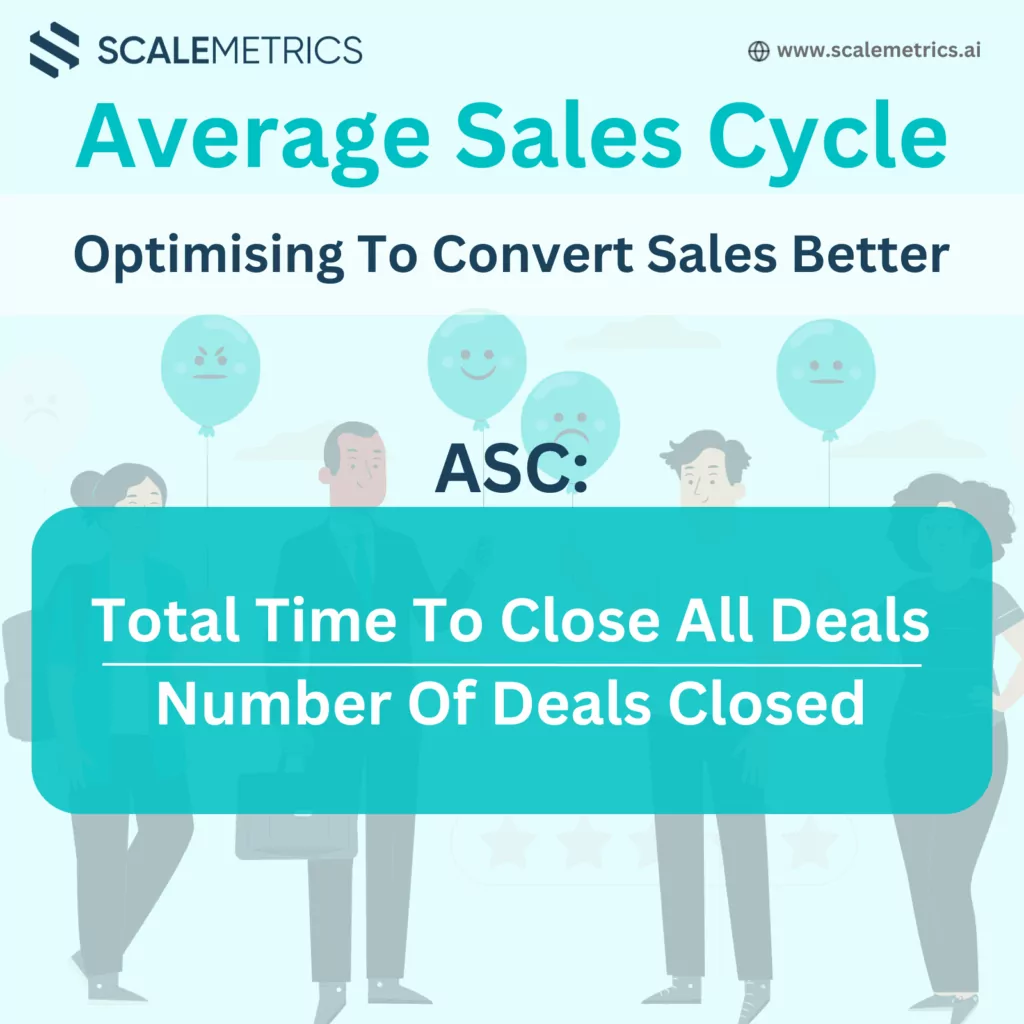
The formula to calculate the average sales cycle is straightforward: Average Sales Cycle=Total Time to Close All Deals/Number of Deals ClosedExample Calculation
Suppose your sales team closed 20 deals in a month. The total time taken to close these deals was 400 days. The average sales cycle would be: Average Sales Cycle=400 days/20 deals=20 days This means, on average, it takes 20 days to convert a lead into a paying customer.Factors Influencing Sales Cycle Length
- Industry and Business Model: Different industries and business models have varying sales cycle lengths. For instance, B2B companies typically have longer sales cycles compared to B2C companies.
- Lead Quality: Higher quality leads are likely to convert faster, shortening the sales cycle.
- Sales Process: An efficient sales process with fewer bottlenecks and streamlined steps will have a shorter cycle.
- Product Complexity: More complex products or services usually require a longer sales cycle due to the need for more detailed customer education and decision-making.
- Market Conditions: Economic conditions, competition, and market trends can impact the length of the sales cycle.
Benchmarking Sales Cycle Length
Benchmarking your average sales cycle length against similar companies or competitors provides valuable information about your business:- Sales Process Quality: If your sales cycle is longer than the industry average, it may indicate inefficiencies in your sales process.
- Product-Market Fit: A shorter sales cycle compared to competitors suggests a better product-market fit and more effective sales strategies.
- Competitive Position: Understanding how your sales cycle compares can help you identify areas for improvement and gain a competitive edge.
Strategies to Optimize Sales Cycle
- Improve Lead Quality: Focus on generating high-quality leads that are more likely to convert quickly.
- Streamline Sales Processes: Automate repetitive tasks, reduce bottlenecks, and simplify steps to speed up the sales process.
- Enhance Sales Training: Equip your sales team with the necessary skills and knowledge to close deals faster.
- Use Data Analytics: Analyze sales data to identify patterns and areas for improvement.
- Customer Feedback: Gather and act on customer feedback to address any issues that may be prolonging the sales cycle.
Example
Salesforce: A leading CRM platform, Salesforce continuously monitors and optimizes its sales cycle. By analyzing sales data and identifying bottlenecks, Salesforce has managed to streamline its sales process, reducing the average sales cycle length and improving revenue predictability. This data-driven approach has contributed to Salesforce’s market leadership and growth.Conclusion
Understanding and optimizing the average sales cycle is crucial for predicting revenue and improving sales efficiency. By calculating this metric and benchmarking it against industry standards, you can identify areas for improvement and implement strategies to shorten the sales cycle. This, in turn, leads to better revenue forecasts, efficient resource allocation, and overall business growth.Related Resources
Scalemetrics helps Swiss SMEs act on decisions like this before market conditions shift. Our budgeting and financial forecasting services and outsourced CFO team give finance directors the senior expertise to move first.
Frequently Asked Questions
What should Swiss SMEs know about importance of Average Sales Cycle The average sales cycle is a critical metric for several reasons: Revenue Prediction: Knowing the average time it takes to close a deal helps in forecasting when revenue will be realized. Sales Process Efficiency: A shorter sales cycle indicates a more efficient sales process. Resource Allocation: Helps in planning and allocating resources more effectively. Market Insights: Benchmarking against industry standards can reveal the quality of your sales process and product-market fit. Calculating Average Sales Cycle The formula to calculate the average sales cycle is straightforward: Average Sales Cycle=Total Time to Close All Deals/Number of Deals Closed Example Calculation Suppose your sales team closed 20 deals in a month. The total time taken to close these deals was 400 days. The average sales cycle would be: Average Sales Cycle=400 days/20 deals=20 days This means, on average, it takes 20 days to convert a lead into a paying customer. Factors Influencing Sales Cycle Length Industry and Business Model: Different industries and business models have varying sales cycle lengths. For instance, B2B companies typically have longer sales cycles compared to B2C companies. Lead Quality: Higher quality leads are likely to convert faster, shortening the sales cycle. Sales Process: An efficient sales process with fewer bottlenecks and streamlined steps will have a shorter cycle. Product Complexity: More complex products or services usually require a longer sales cycle due to the need for more detailed customer education and decision-making. Market Conditions: Economic conditions, competition, and market trends can impact the length of the sales cycle. Benchmarking Sales Cycle Length?
Scalemetrics helps Swiss SMEs act on decisions like this before market conditions shift. Our budgeting and financial forecasting services and outsourced CFO team give finance directors the senior expertise to move first.
What financial services does Scalemetrics provide for Swiss SMEs?
Scalemetrics provides Swiss SME owners and CFOs with practical financial expertise: from accounting and tax compliance to financial planning, KPI monitoring, and on-demand CFO services. The goal is to give growing businesses access to senior financial leadership without the cost of a full-time hire.
When does a Swiss SME need a fractional CFO?
A fractional CFO becomes valuable from around CHF 1–2M in annual revenue, or ahead of specific events: bank financing applications, investor rounds, M&A, or rapid growth phases. The cost is a fraction of a full-time CFO salary, with expertise available immediately.
How does Scalemetrics differ from a traditional Swiss fiduciary firm?
Traditional fiduciary firms focus on tax compliance and year-end accounts. Scalemetrics adds strategic financial leadership: rolling forecasts, cash flow modelling, KPI dashboards, and financing advisory – delivered as an ongoing mandate or for a specific project.
Which Swiss cantons does Scalemetrics cover?
Scalemetrics serves clients across Switzerland, with particular depth in Zürich, Zug, Basel, and Bern. Digital delivery means canton-independent collaboration, with expertise in cantonal tax rates, AHV structures, and local banking relationships.
Sources & References
Why Average Sales Cycle Length Is a Critical Financial Variable
The average sales cycle — the time elapsed between a prospect entering your funnel as a qualified lead and signing a contract — is not merely an operational metric. It is a fundamental determinant of your cash conversion cycle, capital requirements, and revenue predictability. For Swiss SMEs managing tight working capital or seeking bank financing, a long or highly variable sales cycle creates liquidity uncertainty that is difficult to plan around.
Consider the arithmetic: a Swiss B2B SME with CHF 3 million annual revenue target and an average deal size of CHF 25,000 needs to close 120 deals per year. If the average sales cycle is six months, the company must have 60 deals in active pipeline at any given moment to achieve its target — each consuming sales bandwidth, management attention, and overhead cost. Extend the sales cycle to nine months and the required pipeline doubles to 90 active deals. The cost of that expanded pipeline — measured in fully-loaded sales personnel costs including AHV at 5.3%, BVG at 8–12%, and Swiss salary benchmarks — is material and must be planned for explicitly.
Sales cycle length also affects ARR predictability for subscription businesses. A SaaS company with a three-month average sales cycle can model quarterly new ARR additions with reasonable confidence. One with a twelve-month cycle has far lower visibility into the next quarter's revenue — creating the rolling forecast uncertainty that investors and lenders find most uncomfortable.
Diagnosing and Reducing Sales Cycle Length
Long sales cycles in Swiss B2B markets typically stem from four sources: insufficient qualification at lead entry (spending time on poor-fit prospects), internal decision-making complexity at the buyer (multiple stakeholders, formal approval processes), procurement or legal review processes (common in financial services, healthcare, and public sector), and inadequate competitive differentiation (prospects shopping multiple vendors without urgency).
Each cause has a different remedy. Procurement complexity in regulated Swiss industries can rarely be shortened — but can be anticipated with better deal qualification. Competitive differentiation issues require sales methodology improvements and stronger Swiss-market reference cases. Internal buyer complexity can sometimes be navigated by identifying and cultivating a champion who drives internal advocacy.
The OR (Swiss Code of Obligations) governs contract formation, and Swiss buyers in regulated sectors often require legal review of contract terms before signing. Building standardised, legally reviewed contract templates reduces this delay materially — particularly for SMEs targeting cantonal government, financial institutions, or healthcare entities.
Sales Cycle Data as a Planning Input
Average sales cycle data, tracked by deal segment and channel, enables more accurate revenue forecasting. By applying stage-weighted probabilities to each deal in your pipeline and factoring in the expected remaining cycle time, you can build a statistical revenue forecast that is substantially more reliable than a simple top-down target.
| Swiss Industry Segment | Typical Sales Cycle | Primary Delay Factor |
|---|---|---|
| SME / Owner-managed | 1–3 months | Owner availability and urgency |
| Mid-size corporate | 3–6 months | Budget approval, internal alignment |
| Financial services / Insurance | 6–12 months | FINMA compliance review, legal |
| Public sector / Canton | 9–18 months | Public procurement law (BöB/IVöB) |
To integrate sales cycle analytics into your financial planning and build reliable revenue forecasts for your Swiss SME, our financial planning services provide the modelling framework you need.

Pascal Stämpfli leverages over a decade of expertise in corporate finance and venture capital to scale and optimize businesses. A CFA charterholder with a Master's in Economics from the University of St. Gallen, Pascal specializes in market & company assessments, strategy, and business value creation. Having assessed more than 1,000 companies for financial and strategic investors provides him with a sophisticated understanding of investor rationale and capital allocation. As the Managing Director of Scalemetrics and Managing Partner at COREangels Big Data & AI Europe, Pascal operates at the intersection of financial discipline and technological innovation.