
Top 10 Swiss SaaS SMEs to Watch in 2026: Funding + Metrics
Quick Answer
From Zitadel IAM to Exnaton AI energy billing, discover the top Swiss SaaS companies in 2026. NRR benchmarks, funding traction, and growth metrics.
Why Swiss SaaS Dominates 2026 Funding
Switzerland hosts 100+ tracked SaaS firms per F6S, with AI/IAM/energy leaders capturing 30%+ of 756 funded SMEs’ $8.8M early 2026 capital. ETH/EPFL spin-offs excel via DSG compliance and pilot revenue, achieving NRR >125% vs. EU medians amid Deloitte’s AI-cloud mandate.
Macro tailwinds-CHF stability, scientific IP-yield LTV/CAC >4x for top performers, outpacing Berlin by 20% per VentureLab. Founders tracking these 10 gain competitive intelligence: efficiency KPIs driving Lakestar/Helvetica term sheets.
The Top 10 Swiss SaaS SMEs to Watch
Deep Dive: What Makes Them Tick
Zitadel leads IAM disruption-open-source flexibility yields 92% retention vs. enterprise incumbents’ 75%, targeting cloud-native with DSG-ready multi-tenancy.
Exnaton scales energy AI-dynamic tariffs deliver 130% NRR via utility pilots, mirroring Veezoo’s analytics efficiency.
Smeetz transforms venues-AI pricing/ops cut churn 88%, proving horizontal SaaS scalability in leisure.
Golem modernizes ERP-finance AI hits 1.9x capital efficiency, essential for Lakestar thresholds.
Key Metrics Swiss SaaS Founders Must Track
Average top-10 benchmarks crush medians:
- NRR: 128% (vs. 115%)
- Retention: 89% (vs. 72%)
- Magic Number: 1.25 (vs. 0.9)
- CAC Payback: 13 months (vs. 18)
What You Can Implement: 90-Day Competitor Playbook
Days 1-30: Metric Baseline
- Audit vs. top-10 table: Score NRR gap (target +10%).
- Self-serve audit: Match Stacksync’s 85% adoption.
Days 31-60: Pilot Replication
- Launch 3 industry betas like Smeetz (25% ROI proof).
- Compliance upgrade: DSG/IAM like Zitadel.
Days 61-90: VC Positioning
- Build top-10 comps deck: “CHF 8M ARR path at 1.2 Magic.”
- Network: Track 10 peers via SECA/F6S.
Founder Checklist
- NRR trending 125%+?
- 3 pilots matching top-10 ROI?
- Self-serve >80%?
- Compliance at Zitadel level?
- Comp table in pitch deck?
Scalemetrics benchmarks your SaaS against Switzerland’s top 10-schedule competitive analysis at scalemetrics.ai to join 2026’s winners.
FAQs
Q: Which metric separates top Swiss SaaS?
A: Capital efficiency >1.8x-grants + pilots lower burn 25%.
Q: ETH spin-off edge?
A: 30% faster CAC payback via credibility/networks.
Q: Investment timeline?
A: 6-12 months post top-10 metrics alignment.
Related Resources
Scalemetrics helps Swiss SMEs act on decisions like this before market conditions shift. Our corporate tax and VAT compliance services and outsourced CFO team give finance directors the senior expertise to move first.
Sources & References
The 2026 Swiss SaaS Landscape: Patterns Behind the Top Performers
Switzerland's SaaS sector has matured considerably since the first wave of Zurich-based B2B software companies began attracting meaningful VC attention in the 2018–2020 period. The top-performing Swiss SaaS SMEs of 2026 share a set of characteristics that are less about their specific vertical and more about their financial and operational discipline — a pattern that is instructive for any Swiss founder at the growth stage.
The common thread across the companies attracting the most investor interest in 2026 is a sharp focus on solving an expensive, recurring pain point for mid-market European enterprises, combined with the ability to demonstrate that the solution creates measurable, auditable savings or revenue uplift. Buyers in Switzerland are cautious; they need a clear ROI case before committing to enterprise software. The SaaS companies that are scaling fastest in 2026 have embedded that ROI case directly into their sales motion and their customer success programme.
Financial Characteristics of Switzerland's Leading SaaS SMEs
Across the cohort of Swiss SaaS businesses that have raised Series A or Series B capital in 2024–2026, several financial characteristics appear consistently:
Focused market entry followed by geographic expansion. The most efficient Swiss SaaS scaling stories start with deep penetration of the Swiss market — often one or two verticals — before expanding to DACH, then broader Europe. This market discipline keeps CAC manageable during the critical early scaling phase and builds the reference customer base that makes the DACH expansion story credible to investors.
High NRR driven by upsell modules. The strongest performers achieve NRR of 115–130% not through aggressive price increases but through modular product architecture that naturally expands as customers grow. A compliance module, an analytics add-on, or an API tier that unlocks integrations are all examples of upsell paths that create NRR without increasing churn pressure.
Lean headcount relative to ARR. Swiss salary structures are among the highest in Europe. The top-performing Swiss SaaS companies maintain ARR per FTE ratios of CHF 150,000–250,000, achieved through product-led onboarding, self-serve documentation, and AI-assisted customer support that reduces the need for large customer success teams.
Swiss SaaS SME Benchmarks: Key Metrics 2026
| Metric | Median (Top 10 Swiss SaaS) | Bottom Quartile |
|---|---|---|
| ARR growth YoY | 95% | 45% |
| Gross margin | 74% | 58% |
| NRR | 118% | 96% |
| CAC payback (months) | 13 | 22 |
| ARR per FTE (CHF) | 190,000 | 95,000 |
| Rule of 40 score | 48 | 28 |
The gap between the median and bottom quartile in nearly every metric reflects not a difference in product quality but a difference in financial management sophistication. The companies at the top of this list have CFO-level financial discipline embedded in their operating rhythm — monthly board reporting on unit economics, quarterly cohort analysis, and a rolling 18-month financial model that is updated with real data. If your SaaS business is not yet tracking these metrics systematically, a financial controlling engagement is the fastest path to closing that gap.
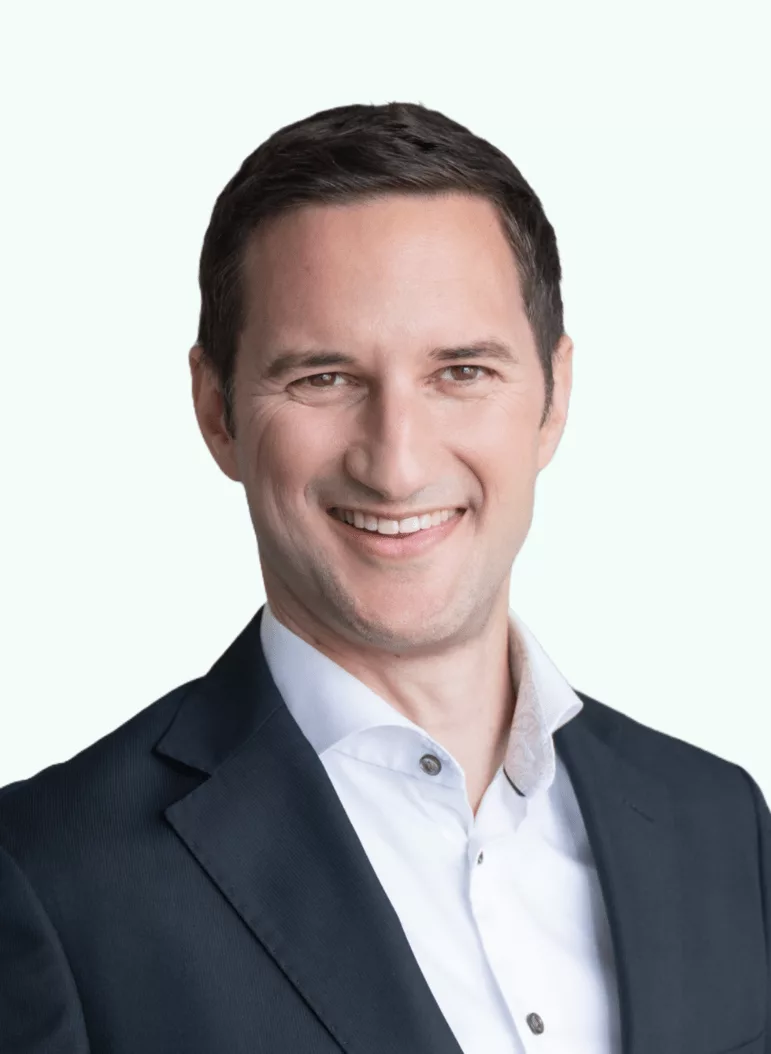
Pascal Stämpfli leverages over a decade of expertise in corporate finance and venture capital to scale and optimize businesses. A CFA charterholder with a Master's in Economics from the University of St. Gallen, Pascal specializes in market & company assessments, strategy, and business value creation. Having assessed more than 1,000 companies for financial and strategic investors provides him with a sophisticated understanding of investor rationale and capital allocation. As the Managing Director of Scalemetrics and Managing Partner at COREangels Big Data & AI Europe, Pascal operates at the intersection of financial discipline and technological innovation.